Perception and reality
How close is what we believe to what the data show?
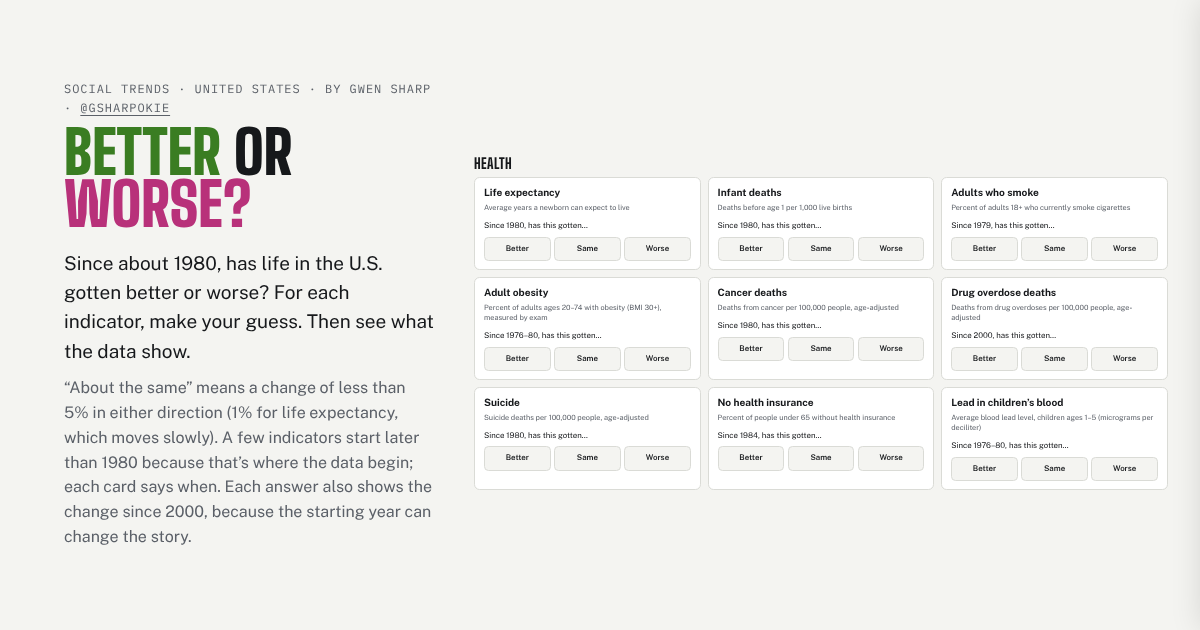
Better or Worse?
Since 1980, has life in the U.S. gotten better or worse? Guess on 26 indicators, then see what the data show, and whether your misses leaned pessimistic.
Play it →
What Do They Really Think?
Guess what Democrats and Republicans believe and who’s in each party, then compare your guesses with survey data and with what each side guessed about the other.
Play it →
Is Crime Up?
Most years, most Americans say crime is rising. Make three guesses, then compare 35 years of Gallup polls with what victimization surveys found.
Play it →
Guess the Share
Out of every 100 people in the U.S., how many are immigrants, and how has that changed since 1850? Make seven guesses, see each answer as 100 people, and compare with what most Americans guess.
Play it →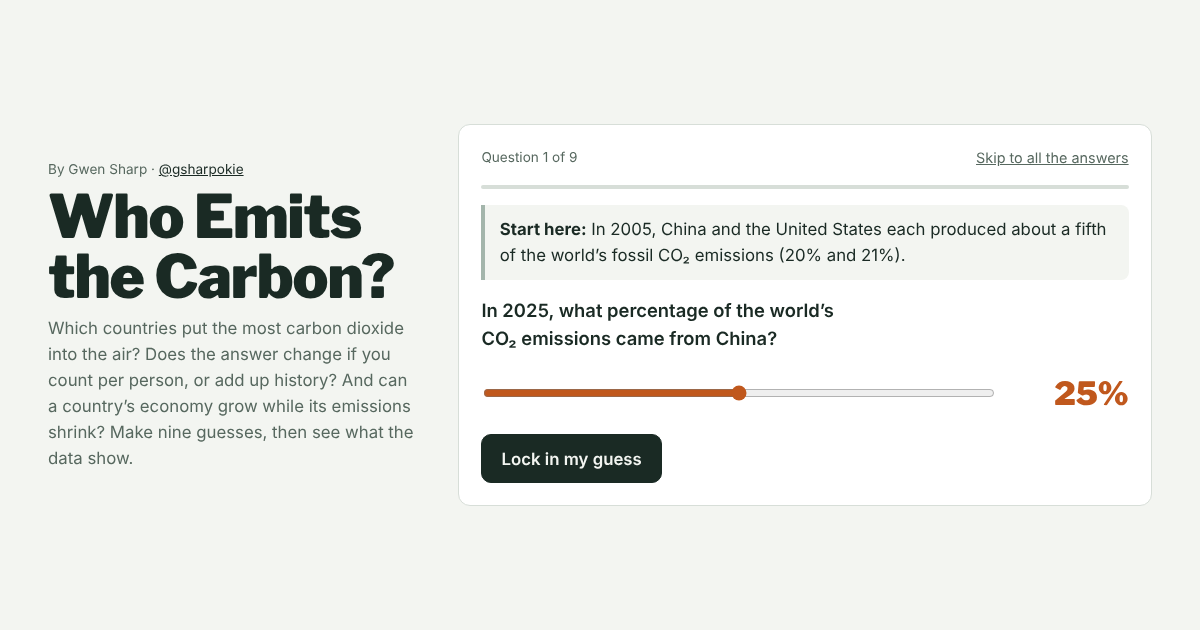
Who Emits the Carbon?
Which countries emit the most: in total, per person, or over history? And can an economy grow while its emissions shrink? Guess, then see the data.
Play it →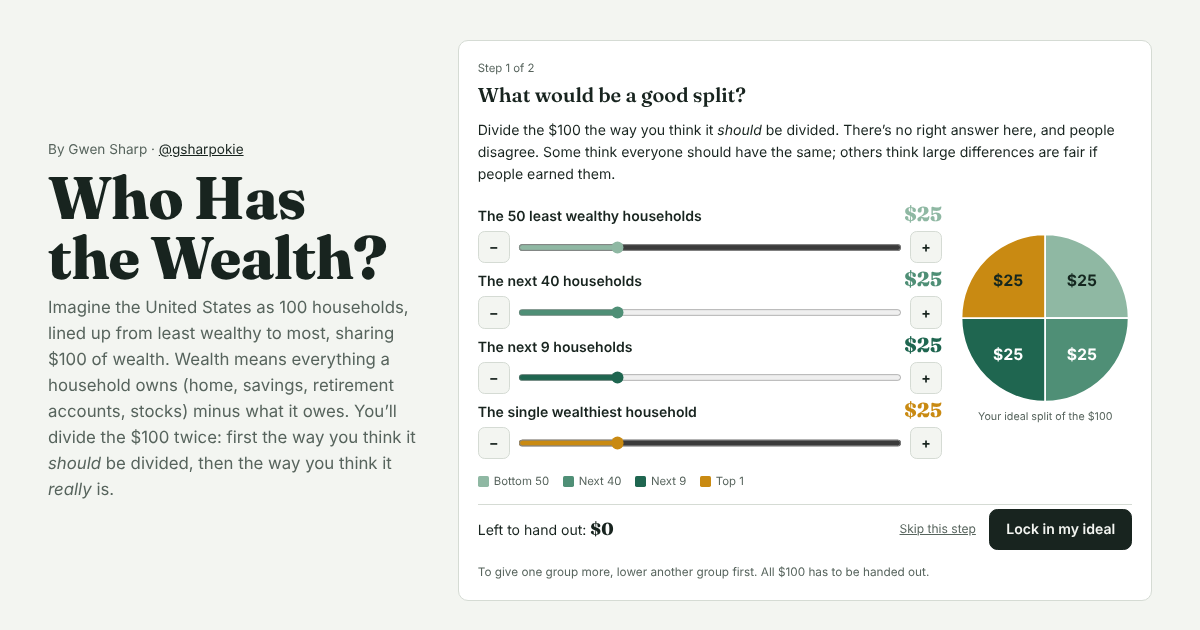
Who Has the Wealth?
Imagine the U.S. as 100 households sharing $100. Divide it the way you think wealth is divided, then see the Federal Reserve’s numbers.
Try it →Gender, race, and identity
Who counts as what, and who decides?
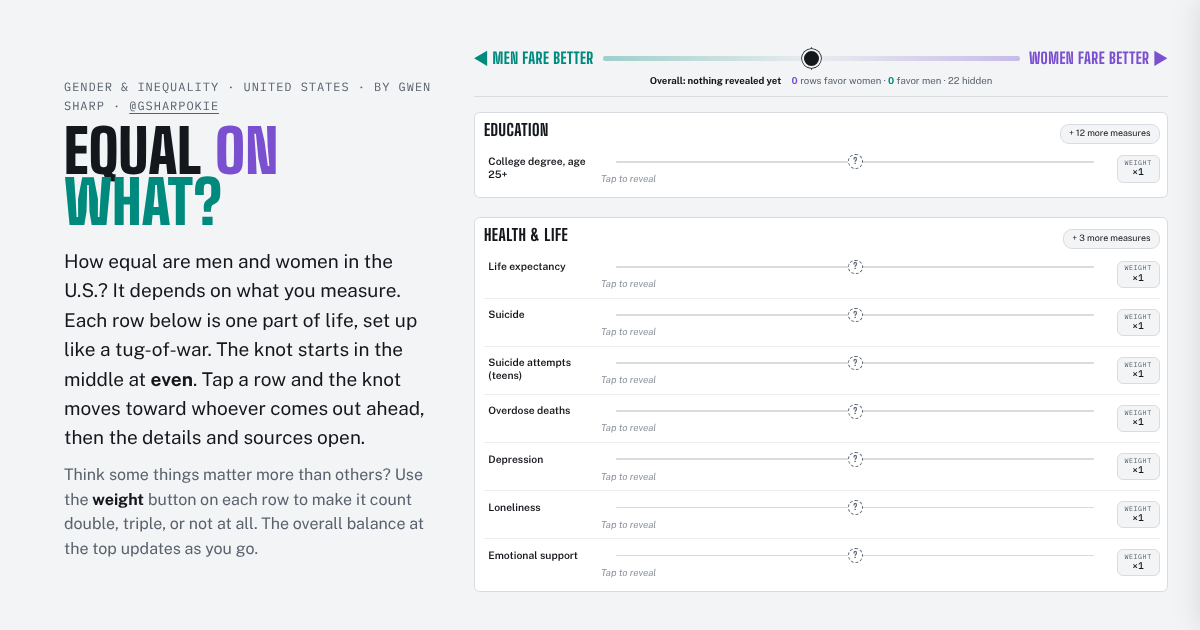
Equal on What?
Who fares better, women or men? It depends on what you measure. Reveal 30+ U.S. measures, compare 1980 with today, and weight what matters to you.
Open the interactive →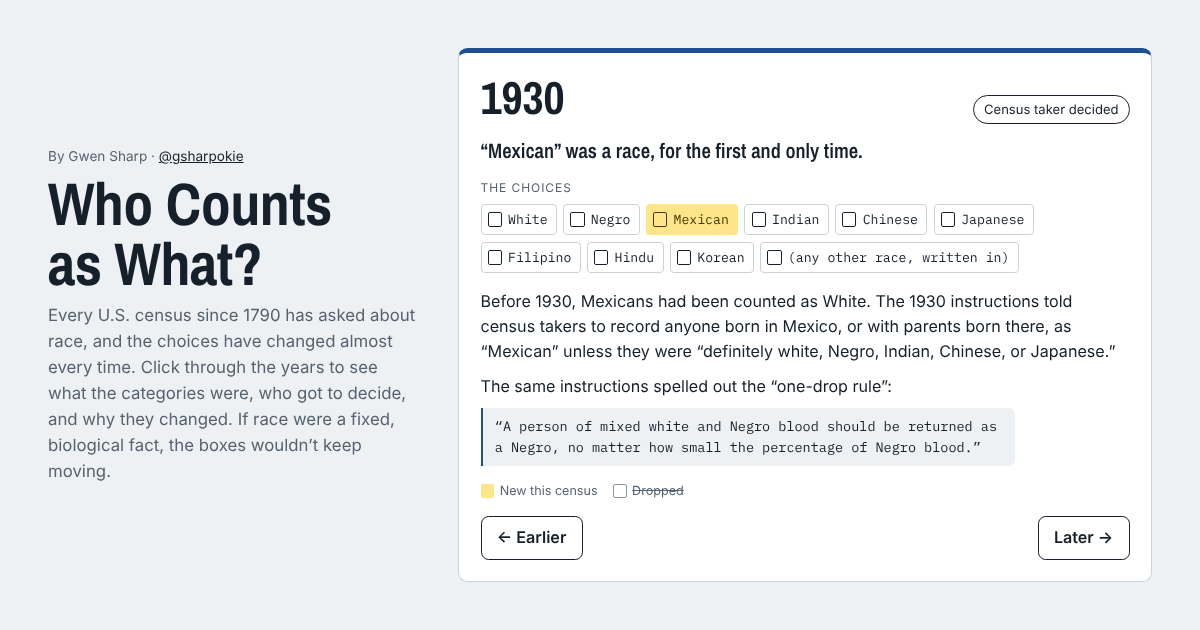
Who Counts as What?
Every U.S. census since 1790 has asked about race, and the choices kept changing. Click through 230 years of categories and follow one person across them.
Explore it →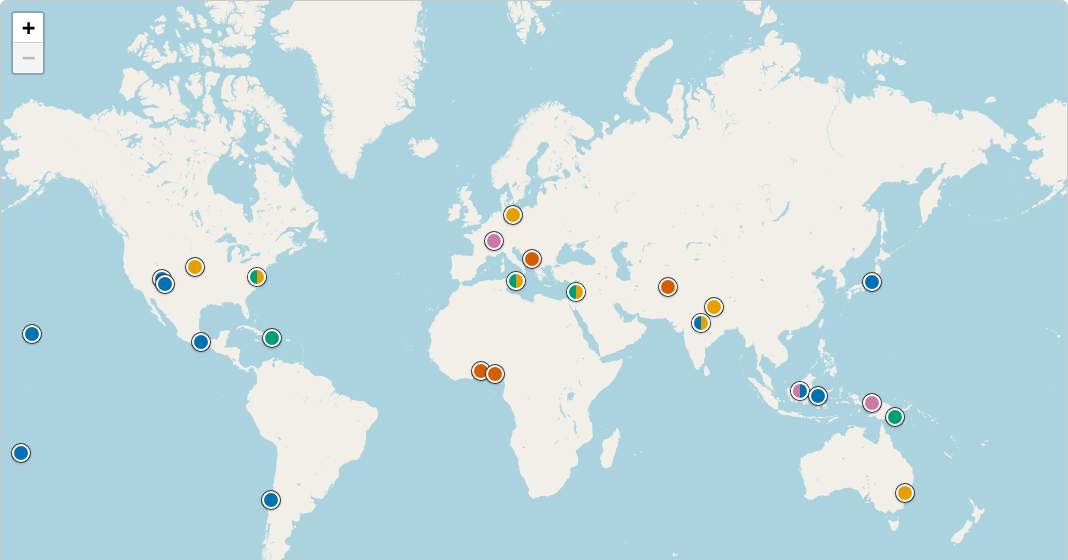
Cultural Variation in Gender
An interactive map of how societies past and present, including the U.S. and Europe, have organized sex and gender, with sources for every place.
Open the map →Culture and social change
How norms, tastes, and lives shift over time.
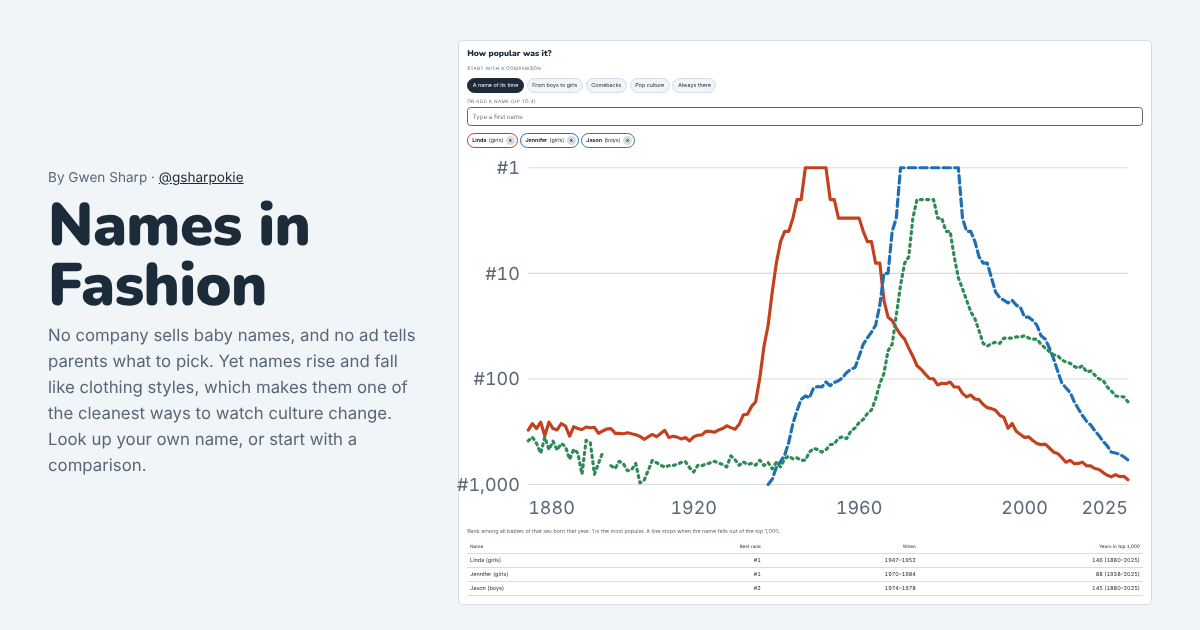
Names in Fashion
No one sells baby names, yet they go in and out of style. Chart any name’s popularity in the U.S. from 1880 to 2025.
Look up a name →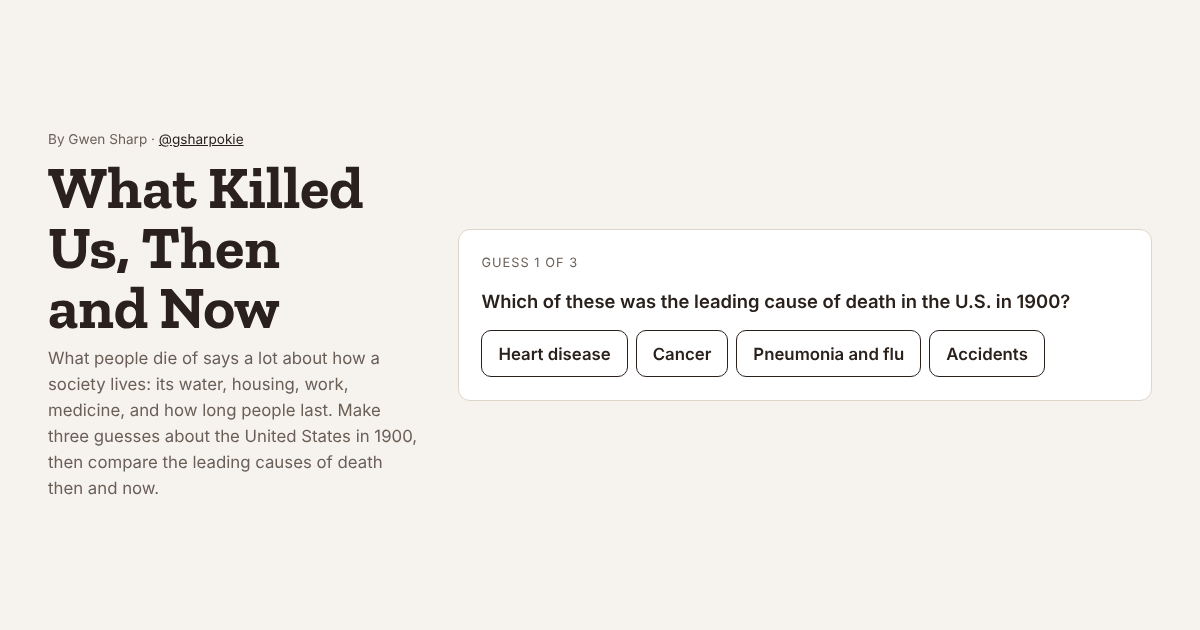
What Killed Us, Then and Now
In 1900 the top killers were infections. Make three guesses, then compare the ten leading causes of death in 1900 and 2024.
Play it →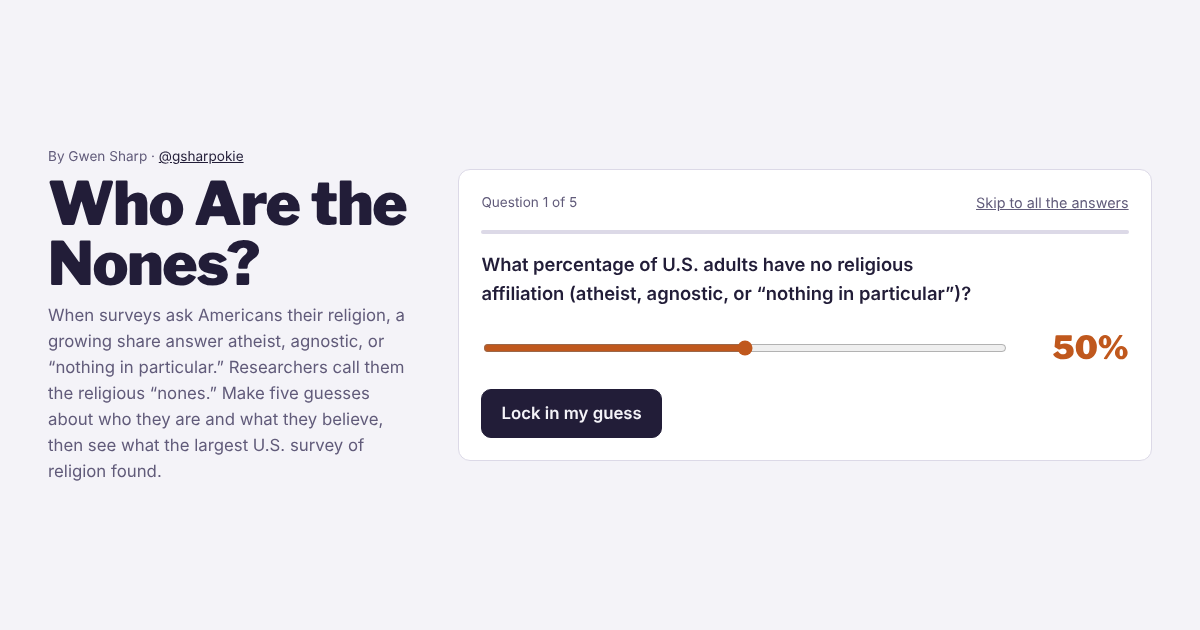
Who Are the Nones?
Three in ten American adults have no religion. Guess how many, who they are, and what they believe, then see the survey data.
Play it →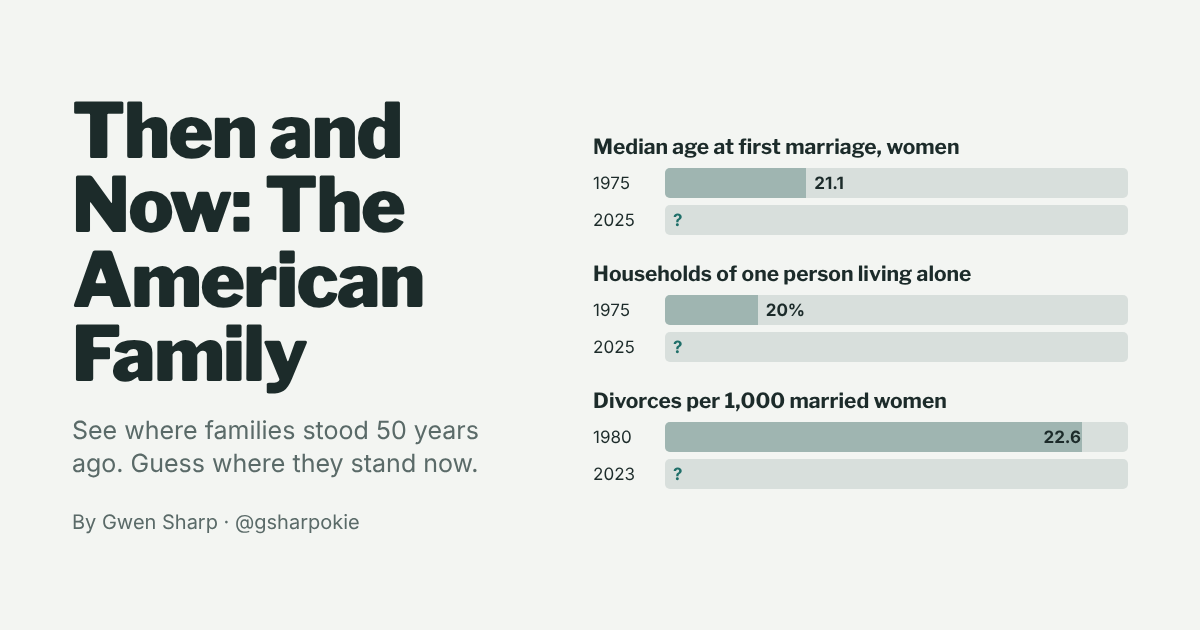
Then and Now: The American Family
See where families stood about 50 years ago on marriage, divorce, births, and living arrangements. Guess where they stand now.
Play it →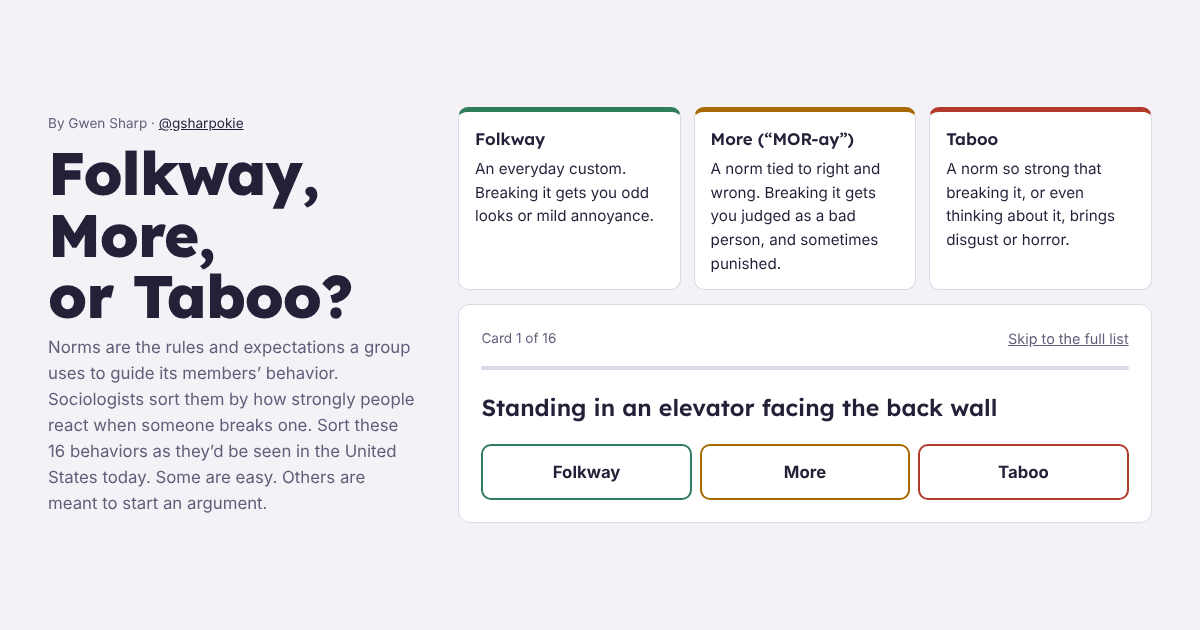
Folkway, More, or Taboo?
Sort 16 behaviors by how strongly people react when someone breaks the rule. Some are easy; some depend on where and when you live.
Start sorting →Reading data
Tools for thinking about where numbers come from.
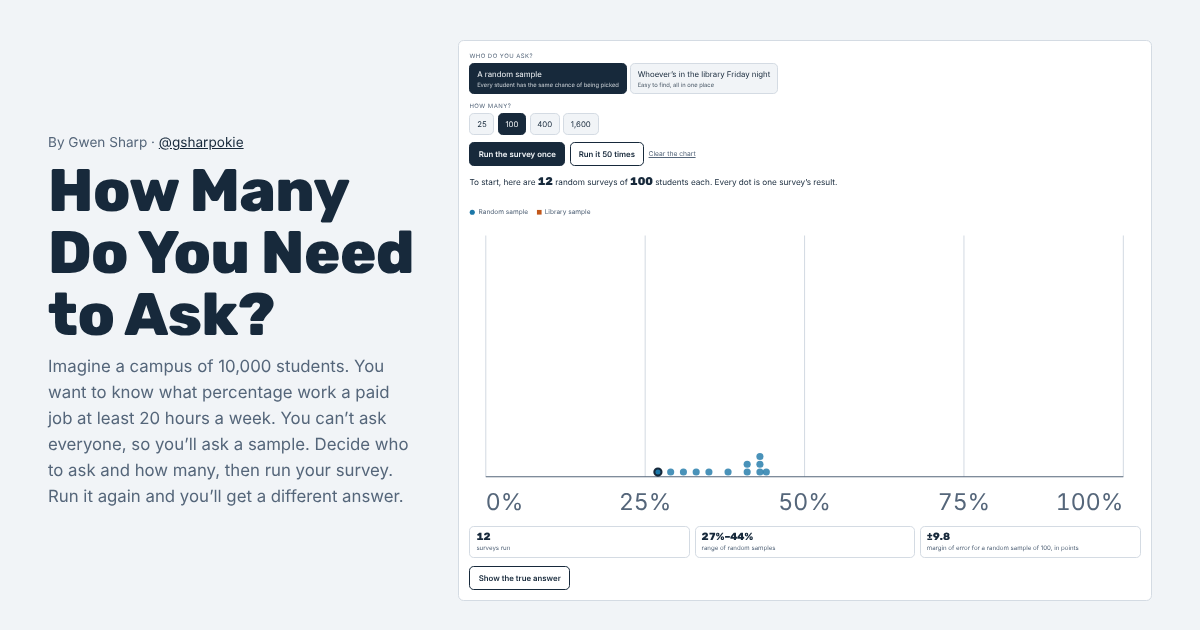
How Many Do You Need to Ask?
Survey an imaginary campus. See how sample size changes your answer, and why a huge sample of the wrong people is still wrong.
Run a survey →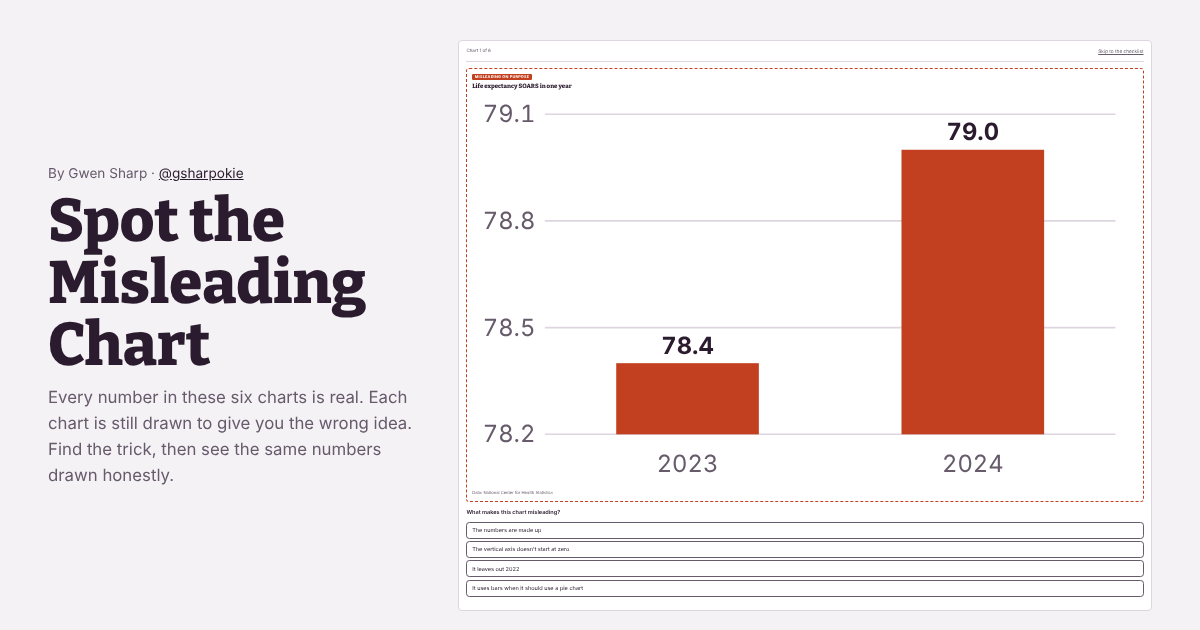
Spot the Misleading Chart
Six charts made from real numbers, each drawn to mislead. Find the trick, then see the same data drawn honestly.
Find the tricks →Accessibility
I want these sites to work for everyone, including people who use screen readers, keyboards, or screen magnification. They aim to meet WCAG 2.1 Level AA.
- All buttons, sliders, and links can be reached and used with a keyboard, and show a visible outline when selected.
- Charts have text descriptions, and many also have a data table or a slider that reads out each value. The map has a searchable list of every place.
- Text meets WCAG AA color contrast standards.
- Pages fit narrow phone screens without sideways scrolling.
I checked the sites in November 2026 with automated accessibility testing plus keyboard and small-screen checks. They haven’t yet been tested by people who use screen readers every day, so there may be problems I haven’t caught. If something doesn’t work for you, please let me know through the “Suggest a correction” link on any project page.